Model Overview
| Model | Structure | Learning | Task | Common Metrics |
|---|---|---|---|---|
| Linear Regression | Linear | Supervised | Regression | MAE, MSE, RMSE, R² |
| Logistic Regression | Linear Boundary | Supervised | Classification | Precision, Recall, F1, ROC AUC |
| Decision Tree | Non-linear | Supervised | Classification / Regression | Task-specific Metrics |
| Random Forest | Non-linear Ensemble | Supervised | Classification / Regression | Task-specific Metrics, OOB Score |
| Support Vector Machine (SVM) | Linear or Kernel | Supervised | Classification / Regression | Task-specific Metrics |
| Neural Network | Non-linear | Usually Supervised | Multiple Tasks | Loss and Task-specific Metrics |
| K-Means | Distance-based | Unsupervised | Clustering | Inertia, Silhouette Score |
| PCA | Linear | Unsupervised | Dimensionality Reduction | Explained Variance, Reconstruction Error |
XAI Example
Explainable AI helps users understand why a machine-learning model made a specific prediction. Rather than treating the model as a black box, techniques such as SHAP show which features contributed most to an outcome.
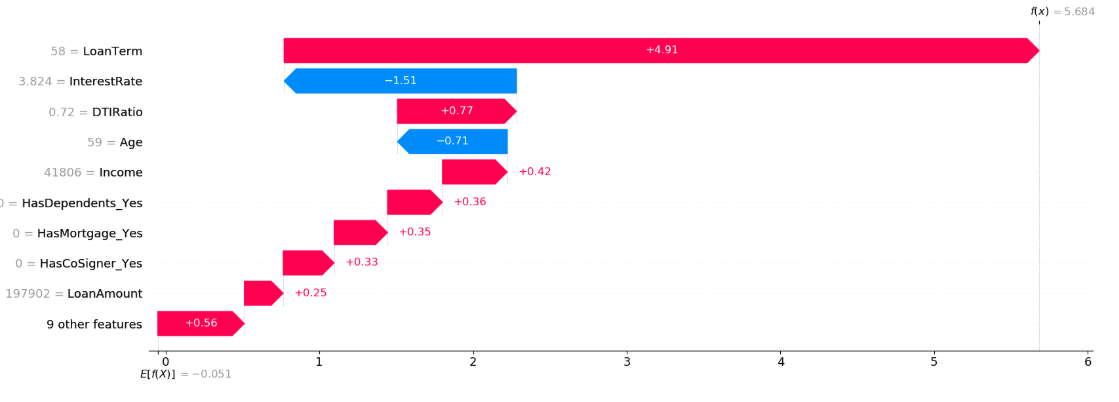
This XAI analysis shows the drivers of a trained credit default model. The model score is diven by (higher) loan term (+4.91), which increases the default, while a lower interest (-1.51) decreases the default.